
#
University Projects 🎓
These projects were developed during my time in the University of Michigan Masters of Applied Data Science (MADS) program. From demographic analyses tackling Detroit's digital divide to cryptocurrency clustering experiments and weather-dependent mobility studies, each assignment pushed me to apply cutting-edge data science techniques to real-world problems.
Whether working with geographic information systems or building interactive visualizations, these projects represent the foundation of skills I use today - from mastering statistical inference to communicating insights through compelling dashboards. Dive into the Streamlit apps below and explore how academic coursework transformed into practical data science practice!
#
Detroit Digital Inclusion Project
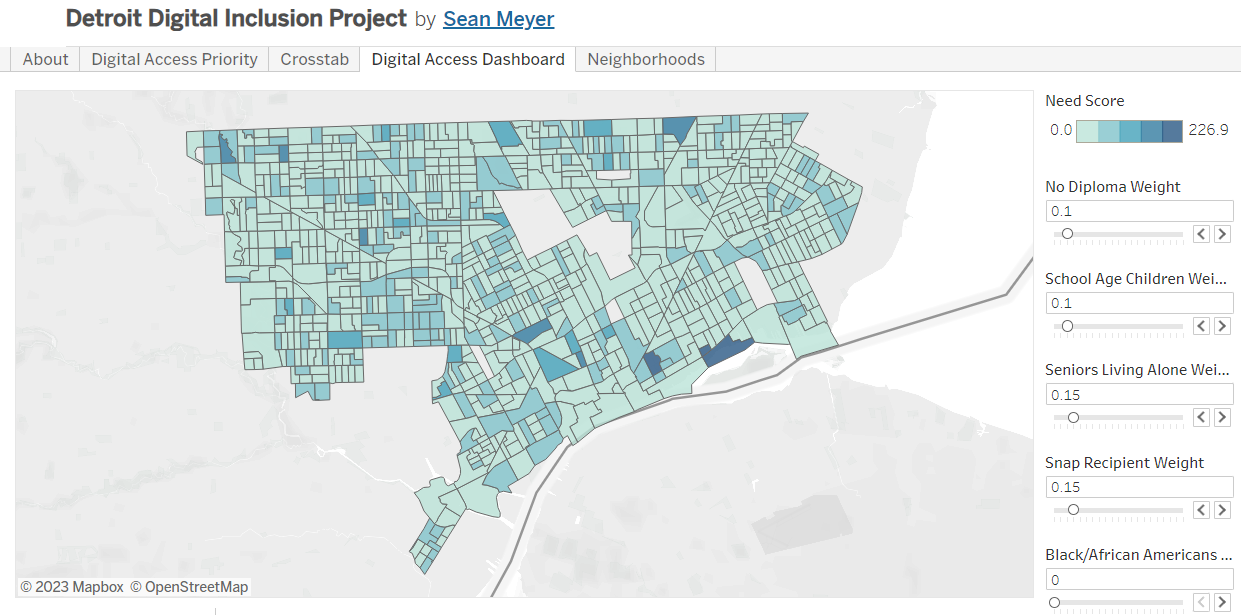
#
Capstone: Finding the Next Big Thing
Full interactive app and code: Streamlit demo | GitHub repo.
#
Milestone II: Cryptocurrency Analysis
Supervised: Next-day price prediction using historical patterns (a practical, if ambitious, forecasting exercise).
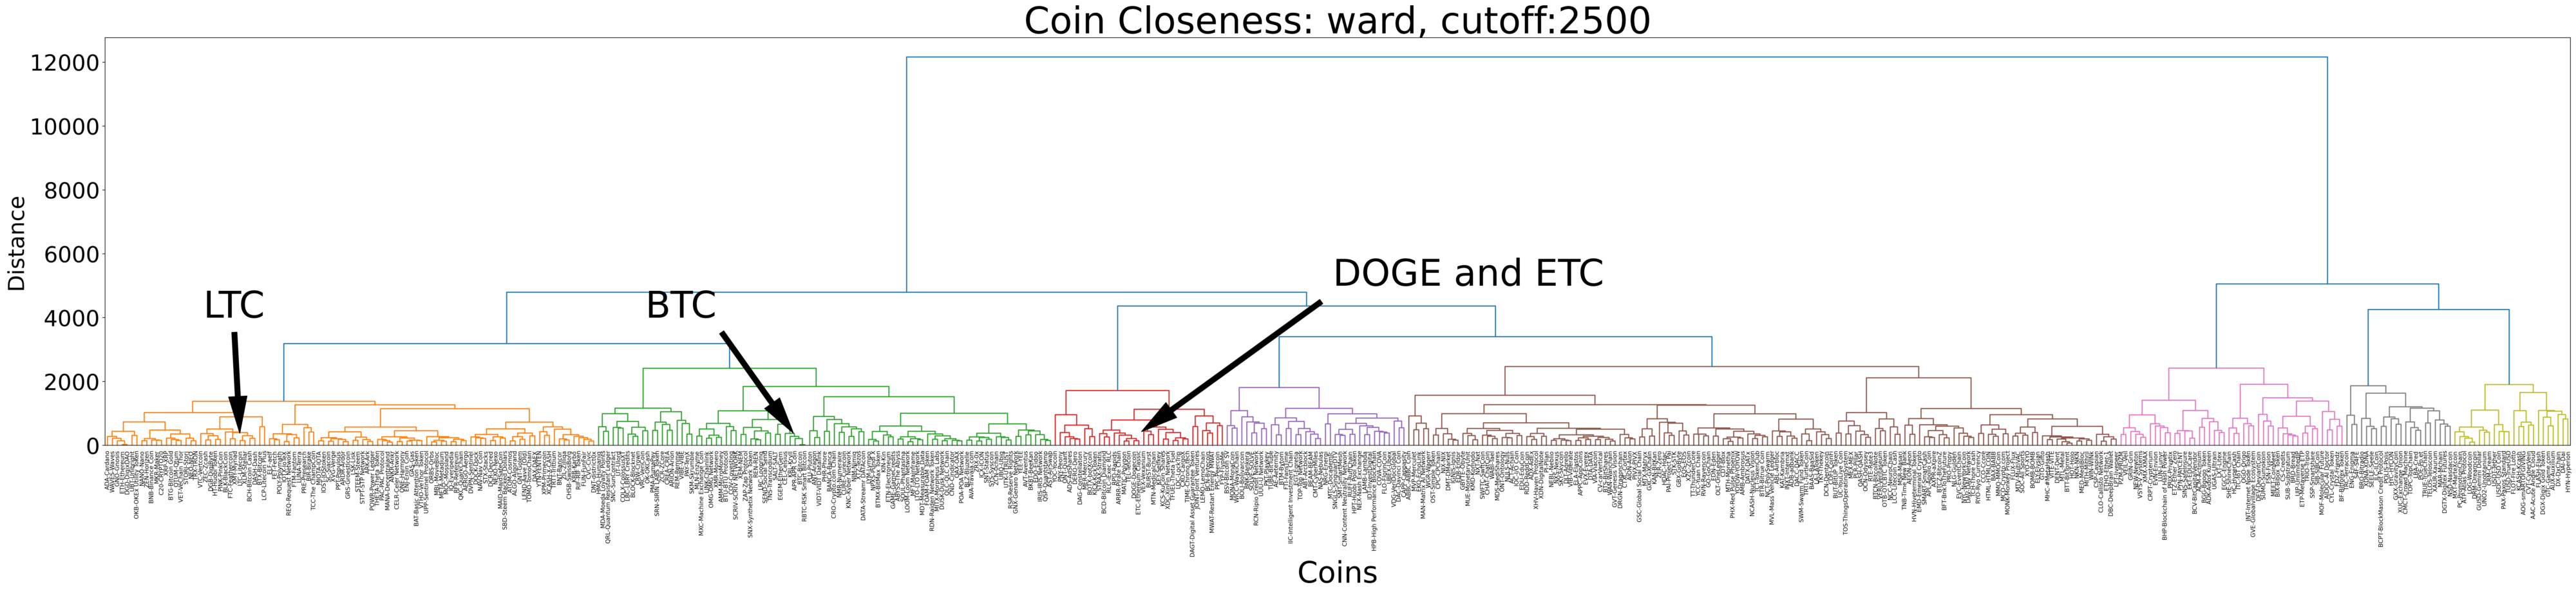
Unsupervised: Discovering "crypto families" - groups of coins whose prices move together. Using dynamic time warping to measure similarity in z-scored price trajectories despite different absolute values, then clustering coins into communities with shared behavior.
The resulting dendrogram reveals interesting market microstructure: smaller altcoins often cluster by ecosystem or use case, while large caps like BTC/ETH form their own independent clusters apart from other large coins. Full interactive app and code: Streamlit demo | GitHub repo.
#
Milestone I: Rain & Taxi Mobility
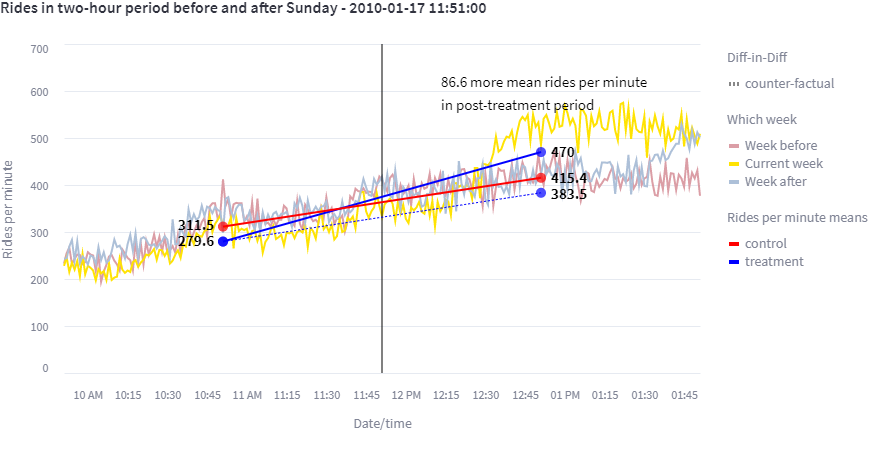
By comparing pre/post rain periods while controlling for time trends, the analysis isolates the causal impact of precipitation on taxi demand. The results show that New Yorkers adapt their travel behavior to weather conditions by taking more taxi rides when there is precipitation compared to a hypothetical dry-day baseline.
Explore the visualization to see how different weather intensities shift mobility patterns. Complete notebook and Streamlit app: GitHub repo | Interactive demo.
#
Test Deepnote to Streamlit
This setup shows how you can collaborate on data projects online while maintaining reproducibility. The included templates demonstrate convenient Deepnote features that streamline the development process.
Want to try it yourself? View the live demo | GitHub repository.